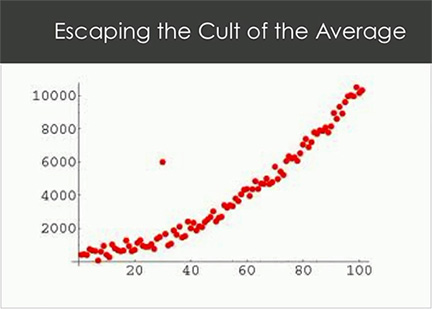
Shawn Achor, in his witty, compelling, funny and engaging TED talk demonstrates this completely made up chart:
He describes:
One of the first things we teach people in economics, statistics, business and psychology courses is how, in a statistically valid way, do we eliminate the weirdos. How do we eliminate the outliers so we can find the line of best fit? Which is fantastic if I'm trying to find out how many Advil the average person should be taking -- two. But if I'm interested in your potential, or for happiness or productivity or energy or creativity, we're creating the cult of the average with science.
The study of that one Outlier on either side of "the average" always tells a valuable story and provides deep insights.
Want to track the performance of your IT support team? The fact that 99% of your support tickets meet an SLA tells you nothing. That one ignored ticket that sat unattended for 3 months shows you bottlenecks in your department.
Want to improve your development practices? The fact that 99% of your customers did not have any escalation last month means nothing. That one team that's quietly shipping remarkable products that customers love deeply year-after-year may have something the rest of your organization can learn from.
Most so called leaders out there like to wear suits, get on stages and talk about the 99 percent that confirm to the line of best fit. But real change happens when you take off those suits get down in the trenches and analyze that one extreme Outlier on either side of average.
The question isn't if these outliers provide you new insights and bring you stories you should be paying attention to. The question is, do you even care about these outliers or do you seek comfort in the cult of the average?
Comments are closed.